New York is the third worst city—behind Newark, N.J., and New Orleans, La.—in terms of urban heat islands, with temperatures reaching an average of more than 7.6 degrees higher than less developed areas nearby.

Liz Donovan
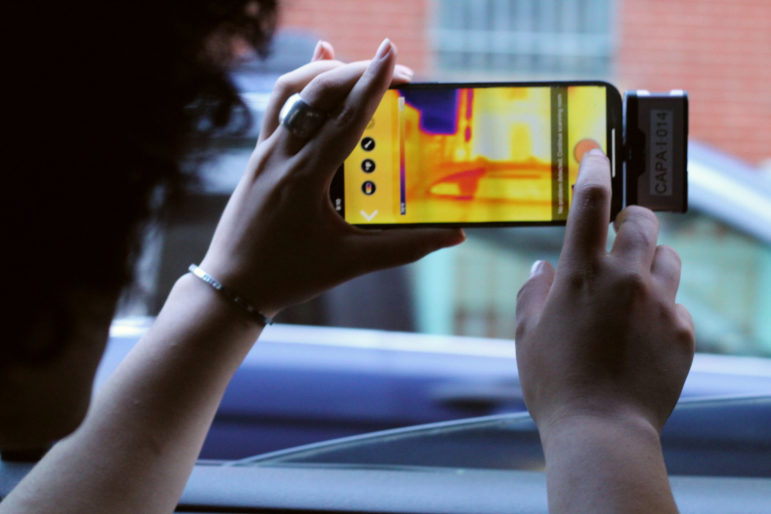
Ashley Fontanilla of South Bronx Unite participates in a heat mapping project.On a scorching Sunday afternoon in late July, Rev. DeForest Raphael wedged a mallet-like transponder in the passenger window of his car so it stood upright on his roof, and went for a slow drive through the South Bronx. When he passed a group of kids playing in a fire hydrant, a thought occurred to him: “That was the only thing between them and the heat,” he said.
Raphael was conducting research that afternoon—and again later than evening—for an ongoing national heat-mapping project, funded by the National Oceanic and Atmospheric Administration (NOAA). The multi-year study of about three dozen cities, including New York, seeks to document urban “heat islands” with a hyperlocal, boot-leather data-collecting process that involves members of communities disproportionately affected by intense urban heat.
Urban heat islands occur when dark, hard surfaces—like asphalt, roads and buildings—absorb the sun’s radiation and release it slowly. Other factors, like tall buildings and a high population density, can make it harder for that trapped heat to escape, creating an oven-like effect. The result is that the city is, on average, hotter than surrounding, less densely-populated areas.
Earlier this week, the United Nations’ Intergovernmental Panel on Climate Change released a damning report saying that an increase in global temperatures of 1.5 degrees Celsius from pre-industrial levels is a certainty over the next two decades. That will result in more frequent extreme weather in cities and urban areas, “such as heatwaves, with more hot days and warm nights,” the report said.
The findings came just days before the city experienced its third heatwave since June.
New York is the third worst city—behind Newark, N.J., and New Orleans, La.—in terms of urban heat islands, with temperatures reaching an average of more than 7.6 degrees Fahrenheit higher than less developed areas nearby, according to a July report by Climate Central.
Parks, trees and waterways can help counterbalance the heat island effect by cooling surrounding areas. But those amenities are often disproportionately distributed in white, more affluent communities, leading to pockets of even hotter heat islands within city limits, often in communities of color.
Liv Yoon, a social scientist at Columbia University’s Earth Institute who is leading the mapping effort in the Bronx and Northern Manhattan, said she was drawn to exploring the link between racism and climate-related physiological risk at a hyperlocal level. She and her colleague, NASA scientist Christian Braneon, have been engaging with local community groups to participate in the study, mapping levels of heat and humidity in their own neighborhoods.
The role of citizens as data collectors is an integral part of the project, Yoon explains.
“My method mainly has been community engagement because I think if we study climate justice and social inequities, you can’t do that without involving communities that are most marginalized, that are completely disproportionately affected,” she said.
Heat islands have previously been studied and mapped, with the hardest-hit parts of the city identified in Northern Manhattan, large swaths of The Bronx, Central Brooklyn and Eastern Queens. But the ongoing NOAA study is unique in that it is using real-time, on-the-ground data to calculate temperature and humidity, rather than satellite images.
The difference, a volunteer-training video explains, is that “near-surface” measurements use a combination of actual air temperatures that are closer to the air felt by the people living there than satellite image might pick up.
Volunteers participating in the data collection meet at a “basecamp” to get their tools, which include a sensor that sits on the top of a car or a smaller sensor that can attach to a bicycle. They then drive around a mapped route at three different predetermined times during the day, as the sensors track temperature and humidity from the street level. Currently, there are about 50 volunteers involved, including members of the nonprofit South Bronx Unite.

Jeanmarie Evelly
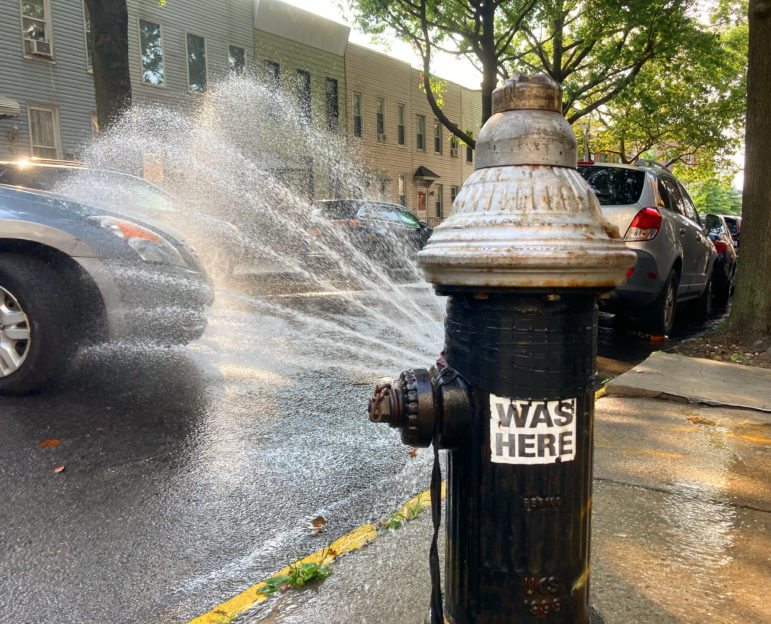
An open fire hydrant in Brooklyn during this week’s heat wave.“They’re not only learning about what’s happening in their community, but they are the scientists that get to determine, or that are part of, seeing that data come alive,” said South Bronx Unite cofounder Dr. Melissa Barber. “When people take ownership of a project, it changes the way they interact with a project, it changes the way they interact with the data, and it changes what it means for them to be a part of the conversation.”
A recent report by American Forests measured the number of trees in neighborhoods around the United States, compared with the racial and economic demographics in those areas. It found that low-income communities and communities of color had fewer greenery than richer, mostly white neighborhoods.
Their report found that New York would need to add 1.5 million trees in order to provide equitable distribution of tree cover across every neighborhood.
“This is the consequence of historic prolonged practices and other things that were discriminatory and racist across the country,” Chris David of American Forests told City Limits.
The practice of cities prioritizing the comfort of white, higher-income communities goes back to a 1930s-era tactic called redlining, in which communities of color were determined by the Home Owners’ Loan Corporation to be “hazardous” for mortgage-lending and outlined in red on maps, Yoon explained. The practice was outlawed in 1968, but the effects remain to this day.
“Urban heat islands are usually described in a scientific way, saying it’s about asphalt, it’s about the density of buildings, it’s about rooftop colors, lack of trees,” said Yoon. “It is about all of that, but it’s also about historically redlined areas and the infrastructure that has followed, or the lack thereof.”
That inequity became even more apparent during the COVID-19 crisis and subsequent lockdowns.
“We were told to go outside to seek refuge from the pandemic, but when your outside space is just industry and highways, that’s not really an option for you,” said Yoon.
The full results of the NOAA study won’t be completed until fall or early winter, but Yoon said she is already having conversations with city agencies about how their data could help with ongoing efforts to create equitable access to cooling areas and parks.
In July, Mayor Bill de Blasio and City Council Speaker Corey Johnson announced that they’d adopted a budget that includes about $620 million for parks. A portion of that supported “Play Fair,” a campaign overseen by New Yorkers for Parks and a coalition of about 300 groups dedicated to maintaining open spaces, including natural areas and forests in the city.
Earlier this summer, a new coalition called Forest for All NYC released a report on urban forests which recommended the city increase its tree canopy from 22 to 30 percent in the next 14 years, and to focus on equitable tree distribution. Adding shade can decrease area temperatures from 20 to 45 degrees, the Environmental Protection Agency reports.
“As heat waves are projected to increase in frequency, intensity and duration in NYC due to climate change, these frontline communities are experiencing the most severe impacts,” the Forest for All report reads.
“We know that there is a significant opportunity and really a need and a compulsion to better distribute the urban forest and we’re very, very dedicated to that,” said Emily Nobel Maxwell, of The Nature Conservancy, who worked on the report.
Many of the individuals taking part in the NOAA study can speak personally to the impact of heat within their communities. “One participant said he lives on 122nd and 3rd, and walking down to the Upper East Side is just a different world,” said Yoon.
Barber, of South Bronx Unite, says her organization plans to use their data to have conversations with elected officials to implement policy changes. She’s confident the findings will back up what she and other South Bronx residents have known for years.
“This is the way in which we have the hard data that says, ‘Here, our communities are hotter, what are you going to do to make green space part of redesigning all of this development that you’re putting here?’” she said.
For Raphael, driving around the city with heat islands in mind shed a light on how stark the difference is between his home in Westchester County and the church where he preaches, the A.M.E. Zion Church on the Hill in Washington Heights.
“The one thing I hope to bring to the rest of the congregation is the lack of fairness,” he said. “We suffer from environmental conditions that are worse in our communities than they are in other communities. And those things are not by accident.”
Liz Donovan is a Report for America corps member.


3 thoughts on “To Measure NYC’s Heat Islands, Scientists Recruit Residents in Hardest-Hit Neighborhoods”
What do you expect in a high population density city full of apartments buildings and office buildings? Of course they retain heat. The lower density areas of the city are more livable according to the map at – https://a816-dohbesp.nyc.gov/IndicatorPublic/HeatHub/hvi.html#jumpto
There is no doubt that the extremes of the Heat island Index as has been experienced in built up urban areas since it was first described in in 1800’s and then resurged as a health concern in 1981, 40 years ago. So indeed lets talk about the Heat Island and the direct causes contributing to it and why after 40 years it still exists. As an example by the well documented increasing decline of vital urban tree canopy by urban tree harms + removal by builder-friendly City Foresters that allow developers to have their way with these irreplaceable public street tree assets. How about the corrupt and misguided NYC Dept of City Planning and the Mayor by his policies that is driving the destruction of entire neighborhoods of former residential single family homes (one home at a time) with their once treed, shaded and well kept vegetated yard space- in exchange for high density zoning and rampant paving. Yet no one investigates that. Instead the new woke fraudsters Liv Yoon types (is described as a social scientist at Columbia University’s Earth Institute who is leading the mapping effort in the Bronx and Northern Manhattan, said she was drawn to exploring the link between racism and climate-related physiological risk) unable to really do her research for the truth of matters, presents instead bafoonery and foolishness. It is troubling isn’t it that so many Marxist academics like Yoon simply can’t help themselves but to present RACE (and GENDER) behind every damn issue in society and imposes that idea upon others- even when it doesn’t exist.
“Marxis academics”? It must be wonderful to dismiss people’s perspectives so easily or to close your mind to the possibility that real people could be positively impacted with some slight changes to urban zoning. Enjoy the concrete you live under!