Jleon
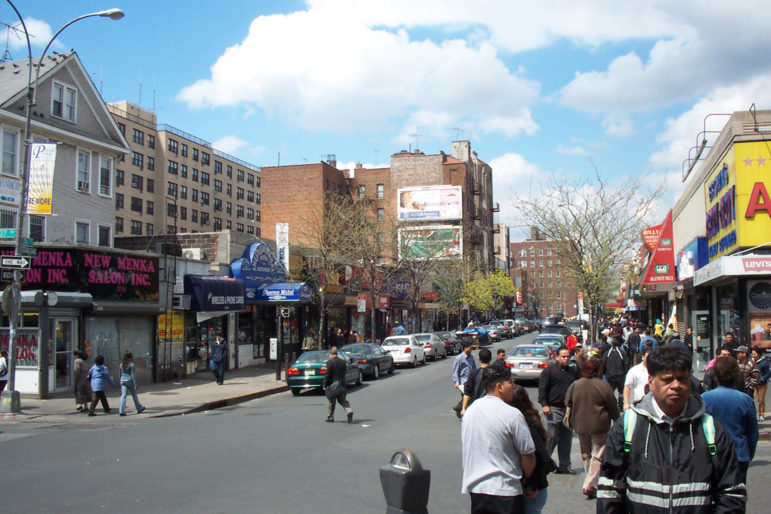
Jackson Heights’ Council district has a small number of voters relative to its population.
The concept of “one person, one vote” has never been meant literally. An age limit has always been in effect, though it was lowered in 1971. In many states, being incarcerated or just convicted of a crime can push a person off the roles temporarily of for life. And obviously, people who don’t register or aren’t citizens aren’t part of that theoretical one-for-one equation.
Still, the concept has enough weight that it led the Supreme Court to essentially invalidate New York City’s system of government in 1988 in deciding that the Board of Estimate, a powerful body where each borough president cast one vote, violated the principle by awarding equal power to Staten Island and Brooklyn despite the vast difference in their populations.
With that history in mind, it is interesting to look at the city’s Council districts, which each elect a member with one vote.
There are differences among the districts in terms of their population, but these are modest. There is variation as well in the number of active registered voters in each district.
But the truly striking difference is in the share of people who are active registered voters in each district. It ranges from one voter per 1.37 people in Inwood to one voter per 3.17 people in Elmhurst/Jackson Heights.
Viewed one way, that means some areas of the city have a bigger hand at the ballot box than others.
| Council District | Active registered voters | Population as of 2010 | People per voter | Voters per capita |
| 21 | 54,434 | 172,670 | 3.17 | 0.32 |
| 20 | 64,185 | 160,913 | 2.51 | 0.40 |
| 44 | 66,637 | 164,339 | 2.47 | 0.41 |
| 15 | 72,101 | 167,995 | 2.33 | 0.43 |
| 38 | 68,254 | 157,282 | 2.30 | 0.43 |
| 25 | 71,287 | 162,560 | 2.28 | 0.44 |
| 17 | 79,600 | 180,064 | 2.26 | 0.44 |
| 16 | 80,461 | 176,956 | 2.20 | 0.45 |
| 47 | 76,139 | 161,814 | 2.13 | 0.47 |
| 13 | 79,325 | 168,530 | 2.12 | 0.47 |
| 24 | 79,368 | 167,448 | 2.11 | 0.47 |
| 14 | 75,839 | 158,876 | 2.09 | 0.48 |
| 11 | 79,902 | 162,922 | 2.04 | 0.49 |
| 30 | 76,352 | 154,608 | 2.02 | 0.49 |
| 37 | 78,308 | 158,438 | 2.02 | 0.49 |
| 32 | 81,178 | 163,306 | 2.01 | 0.50 |
| 26 | 82,300 | 161,419 | 1.96 | 0.51 |
| 43 | 86,441 | 169,098 | 1.96 | 0.51 |
| 49 | 88,185 | 170,363 | 1.93 | 0.52 |
| 18 | 88,205 | 169,410 | 1.92 | 0.52 |
| 48 | 84,061 | 158,086 | 1.88 | 0.53 |
| 12 | 91,167 | 171,182 | 1.88 | 0.53 |
| 31 | 85,424 | 160,123 | 1.87 | 0.53 |
| 22 | 79,980 | 146,509 | 1.83 | 0.55 |
| 19 | 84,856 | 155,237 | 1.83 | 0.55 |
| 42 | 90,657 | 165,150 | 1.82 | 0.55 |
| New York City | 4,496,115 | 8,175,133 | 1.82 | 0.55 |
| 1 | 94,198 | 168,966 | 1.79 | 0.56 |
| 8 | 92,835 | 162,606 | 1.75 | 0.57 |
| 29 | 84,462 | 147,922 | 1.75 | 0.57 |
| 41 | 88,350 | 153,328 | 1.74 | 0.58 |
| 23 | 88,888 | 151,382 | 1.70 | 0.59 |
| 40 | 86,689 | 146,522 | 1.69 | 0.59 |
| 33 | 101,724 | 170,735 | 1.68 | 0.60 |
| 34 | 94,632 | 158,141 | 1.67 | 0.60 |
| 46 | 100,002 | 165,679 | 1.66 | 0.60 |
| 50 | 94,932 | 155,537 | 1.64 | 0.61 |
| 27 | 95,435 | 155,898 | 1.63 | 0.61 |
| 28 | 90,383 | 147,327 | 1.63 | 0.61 |
| 2 | 99,792 | 161,554 | 1.62 | 0.62 |
| 5 | 100,409 | 161,269 | 1.61 | 0.62 |
| 51 | 98,659 | 157,906 | 1.60 | 0.62 |
| 3 | 110,546 | 173,254 | 1.57 | 0.64 |
| 7 | 99,970 | 156,217 | 1.56 | 0.64 |
| 9 | 105,875 | 164,423 | 1.55 | 0.64 |
| 45 | 92,014 | 140,433 | 1.53 | 0.66 |
| 36 | 98,562 | 148,936 | 1.51 | 0.66 |
| 39 | 102,998 | 154,341 | 1.50 | 0.67 |
| 4 | 105,658 | 155,199 | 1.47 | 0.68 |
| 6 | 115,367 | 163,820 | 1.42 | 0.70 |
| 35 | 109,159 | 151,793 | 1.39 | 0.72 |
| 10 | 99,930 | 136,647 | 1.37 | 0.73 |
(Sources: City Council Enrollment Totals, Census Demographics at the NYC City Council district level)
It’s not a simple picture: Some of the districts with a low proportion of voters to people have very few voters, period. That means, on one hand, each voter in those districts has a bigger say in electing a Councilmember, while on the other hand, the district as a whole has low weight in borough- and citywide races.
Of course, none of this matters if the registered voters in any area don’t turn out on Election Day; rates of participation differ by district as well.
It’s also worth noting that the Census figures used above are dated—meaning if some neighborhoods have grown faster than others, the weights would be different today—and, well, that they are Census figures, meaning that neighborhoods with high numbers of low-income or undocumented people whom the Census might miss likely have less representation than indicated.
Those qualifications aside, the disparities are striking. There are policy tools under discussion that could help address the issue. There is a concerted effort to make it easier for everyone to register to vote. The NYCLU has worked to help ex-offenders get back on the voting rolls. And non-citizen voting, while controversial, is an idea that, if its inclusion as a question in this week’s public advocate debate is any indication, has gained more traction in recent years.


