As City Limits reported earlier today, the City Council race in District 9 is an interesting one: Bill Perkins, who represented the district during an earlier stint in the Council before becoming a state senator, took the office again after a February special election. While Council incumbents are usually safe (with districts 6, 14, 35 and 40 as possible exceptions this year), Perkins’ newness in the post appears to have emboldened a large field of candidates hoping to make his second term at City Hall a short one.
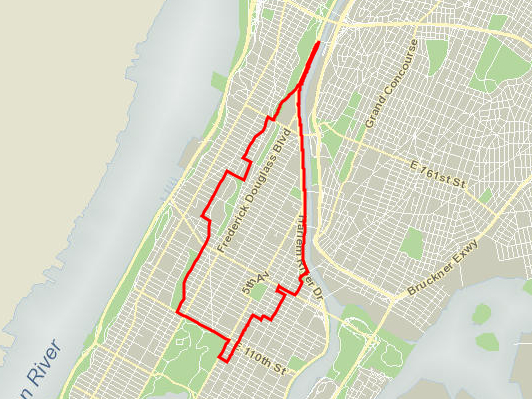
Underlying the personal narrative of the race is the district itself, which encompasses Central Harlem, Morningside Heights and parts of the Upper West Side and East Harlem, covering the running north from Central Park up to the Harlem River. As some of the stats we present below indicate, the area has undergone perhaps the most dramatic shift in local demographics seen anywhere in the city.
Registration
Democrat (87,301) 82.46%
Republican (3,305) 3.12%
Conservative (120) 0.11%
Green (193) 0.18%
Working Families (356) 0.34%
Independence (2,265 ) 2.14%
Women Equality (42) 0.04%
Reform (4) 0.00%
Other (35) 0.03%
Blank (12,254) 11.57%
Total (105,875)
Election Results
Special Election: February 14, 2017
Bill Perkins (3,933) 34%
Marvin Holland (2,129) 18%
Athena Moore (1,715) 15%
Larry Scott Blackmon (1,371) 12%
Cordell Cleare (1,101) 9%
Dawn Simmons (596) 5%
Charles Cooper (353) 3%
Todd Stevens (184) 2%
Caprice A. Alves (173) 1%
Demographics
Council districts are not coterminous with the community districts on which many statistics are calculated, but Council District 8 and Manhattan Community Board 10 overlap almost perfectly. According to the Furman Center’s annual report on CDs around the city:
–The area has seen a remarkable demographic shift, with the Black share of population shrinking from
77.3 percent in 2000 to 54.1 percent black in 2015. Latino (growing from 16.8 percent to 28.9 percent) and Whites, whose share more than septupled to 15 percent, filled the gap. It’s worth noting, however, the Whites are still a stark minority in the area.
–The district has the best subway access of any district the Furman Center examined: 100 percent of residents are within a half-mile of a subway station.
–It also has very bad school test scores: In 2016, only 56 percent of local students achieved proficiency in English and only 59 percent did so in math.
Campaign finance
District 9 hasn’t attracted a huge amount of contributions so far: Only two candidates have booked any donations at the maximum level for a Council race, which is $2,750. Here are the recipients and who they received the max from:
Bill Perkins
United Federation of Teachers
1199 SEIU-NYS Political Action
32BJ United ADF
Corey 2017
Doctors Council SEIU COPE
Mark Levine 2017
Marvin Holland
LiUNA! NYC
Mason Tenders PAC
Transport Workers Union
TWU Local 100


One thought on “A District at the Epicenter of Demographic Change”
You refer to district 8 when you mean 9 in the first paragraph of the demographics section.
Bed-Stuy and Crown Heights have undergone pretty similar transformations and actually have lost more black population in terms of # of people as opposed to % change in neighborhood.
Real estate is working as designed, displacing more and more every year while the remaining institutions to keep people in place are threatened or slowly erode, i.e. NYCHA and rent-regulation… sad!
Check the report from here for raw numbers:
https://comptroller.nyc.gov/reports/new-york-city-neighborhood-economic-profiles/