Momos
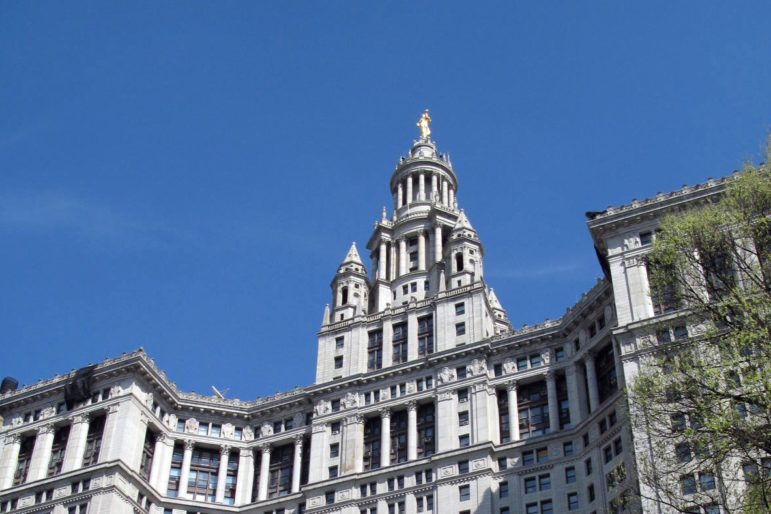
The offices of the public advocate are in the Municipal Building.
Monday night sees the first debate for the general election for public advocate, featuring incumbent Democrat Letitia James and Republican challenger JC Polanco. The office for which they are vying is multifaceted, unique to New York, a stepping stone for a mayoral nomination (Mark Green and Bill de Blasio both got one) and very small compared with the city’s budget, as the chart below indicates. The data comes from the Independent Budget Office; the calculations are ours.
Watch or listen to the debate at 7 p.m. tonight on NY1, NY1 Noticias or WNYC.
| Fiscal Year | Total budget, office of the public advocate | Total city budget | Public advocate share |
| 2016 | $3,311,404 | $80,528,538,307 | 0.0041% |
| 2015 | $2,746,664 | $78,581,696,096 | 0.0035% |
| 2014 | $2,322,364 | $73,410,768,666 | 0.0032% |
| 2013 | $2,241,123 | $71,562,342,285 | 0.0031% |
| 2012 | $2,236,232 | $67,527,971,282 | 0.0033% |
| 2011 | $2,212,180 | $65,876,253,218 | 0.0034% |
| 2010 | $2,573,048 | $63,390,689,510 | 0.0041% |
| 2009 | $2,806,187 | $60,641,504,474 | 0.0046% |
| 2008 | $3,115,431 | $62,425,097,386 | 0.0050% |
| 2007 | $3,030,709 | $59,126,968,408 | 0.0051% |
| 2006 | $2,901,479 | $54,363,948,242 | 0.0053% |
| 2005 | $3,110,029 | $53,135,894,242 | 0.0059% |
| 2004 | $2,062,545 | $47,619,962,731 | 0.0043% |
| 2003 | $1,851,971 | $44,640,506,036 | 0.0041% |
| 2002 | $2,821,435 | $41,164,885,730 | 0.0069% |
| 2001 | $2,667,967 | $40,511,207,499 | 0.0066% |
| 2000 | $2,629,795 | $38,119,663,509 | 0.0069% |
| 1999 | $2,533,878 | $36,107,876,832 | 0.0070% |
| 1998 | $2,564,979 | $35,174,341,882 | 0.0073% |
| 1997 | $2,458,579 | $33,981,325,232 | 0.0072% |
| 1996 | $2,354,929 | $32,310,550,941 | 0.0073% |
| 1995 | $2,354,903 | $31,818,213,504 | 0.0074% |
| 1994 | $3,326,456 | $31,585,702,458 | 0.0105% |