Jim Henderson
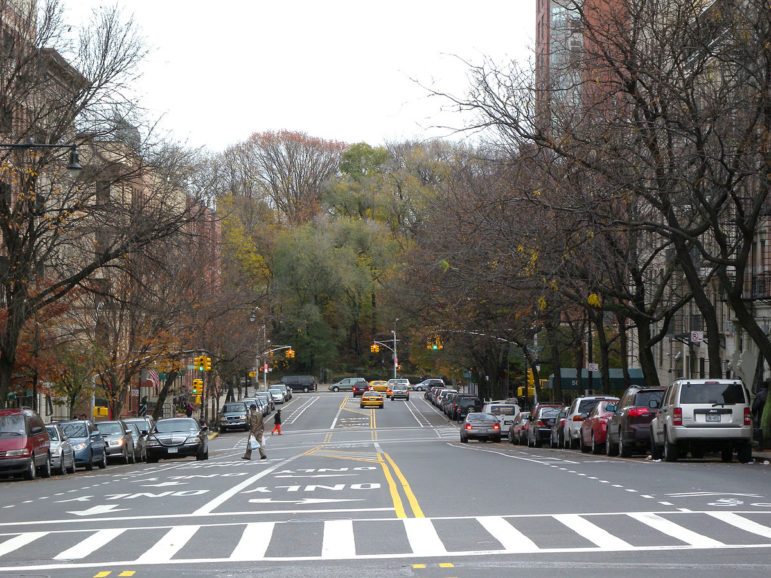
Looking east down 106th Street from Columbus Avenue towards Manhattan Avenue and Central Park.
In 2013 as in earlier years, candidates in some Council races around the five boroughs were able to win primary elections with 2,000 or so votes—a remarkably small sliver of the population in districts whose censuses rival that of small cities. Since some contests featured more than two candidates but drew only 5,000 or 6,000 voters, a campaign might prevail simply by turning out as many people as attend a high-school football game.
This was not the case in district 6, an H-shaped area on the Upper West Side. The 29,000 ballots cast in the local 2013 Council primary represented the highest total in the city—a third larger than the next best and more than twice the average. Among other things, the superlative turnout in district 6 probably reflects the fact that the area has more voters (115,000 active ones) than any other Council district.
Where were the most votes cast in the 2013 Council primaries?
* * * *That fact and that history introduce another intriguing element to the already intriguing primary battle in district 6 this year among Councilmember Helen Rosenthal, 2013 second-place primary finisher Mel Wymore and Cary Goodman. There’s no science to predicting which Council races are close—polls are rarely done on a district level and they’d be hard to trust even if they were—but there’s enough money, name recognition and local controversy in the area to make for an interesting contest. Add a large voting pool, which increases the pressure on candidates to appeal broadly to the neighborhood as opposed to simply assembling blocs of votes, and this is definitely a race to watch.
The charts below describe the political profile of the district. In terms of demographic and social factors, Council District 6 is nearly conterminous with Community District 7, which, according to the Furman Center, has seen almost no racial or class shift over the past 15 years.
Among the 55 areas around the city that Furman compares every year, Manhattan CD7 has the highest income diversity ratio—meaning the largest gap between high- and low-income households in the district. It has a lot of seniors (ranked 4 in the city) not many kids (ranked 53 for population share of households with people 18 or younger) and has a fairly small foreign-born population (46 districts have a larger one).
The stats demonstrate that District 6 (which encompasses the neighborhoods of Lincoln Square, the Upper West Side and Clinton) has a highly educated population, schools that post good test scores and great access to transit and parks. Rents are high (6th highest in the city) but foreclosures are rare, overcrowding is uncommon and there’s a fairly high vacancy rate and a relatively low median rent burden.
Development, however, has been brisk: The area ranks seventh for the number of new residential units due to come on line. That’s one reason why development is a big issue in the race. We’ll see on September 12 how many voters are motivated by that issue, or others, to come out in District 6.
| 2017 Voter Registration | ||
| Voters | Share | |
| Democrat | 80,336 | 69.64% |
| Republican | 11,108 | 9.63% |
| Conservative | 147 | 0.13% |
| Green | 177 | 0.15% |
| Working Families | 113 | 0.10% |
| Independence | 3,044 | 2.64% |
| Women Equlity | 21 | 0.02% |
| Reform | 0 | 0.00% |
| Other | 41 | 0.04% |
| Blank | 20,380 | 17.67% |
| Total | 115,367 |
| 2013 Democratic Primary | ||
| Votes | Share | |
| Ken C. Biberaj | 2,645 | 9.20% |
| Aaron Braunstein | 387 | 1.35% |
| Debra Cooper | 2,482 | 8.63% |
| Noah E. Gotbaum | 3,512 | 12.22% |
| Marc A. Landis | 5,566 | 19.36% |
| Helen K. Rosenthal | 7,716 | 26.84% |
| Mel Wymore | 6,440 | 22.40% |
| Total Votes | 28,749 |
| 2013 General Election | ||
| Votes | Share | |
| Helen K. Rosenthal (Democratic) | 29,586 | 71.60% |
| Harry Demell (Republican) | 4,928 | 11.93% |
| Marc A. Landis (Working Families) | 2,538 | 6.14% |
| Thomas Siracuse (Green) | 737 | 1.78% |
| Total Votes | 41,324 |


