NYC HPD
From the city presentation released in October.
Is the de Blasio administration muffing the math on affordable housing?
In a sentence justifying the focus of the mayor’s affordable housing plan, a city PowerPoint presentation issued in October misstated the facts about which New Yorkers suffer the most from rent burdening.
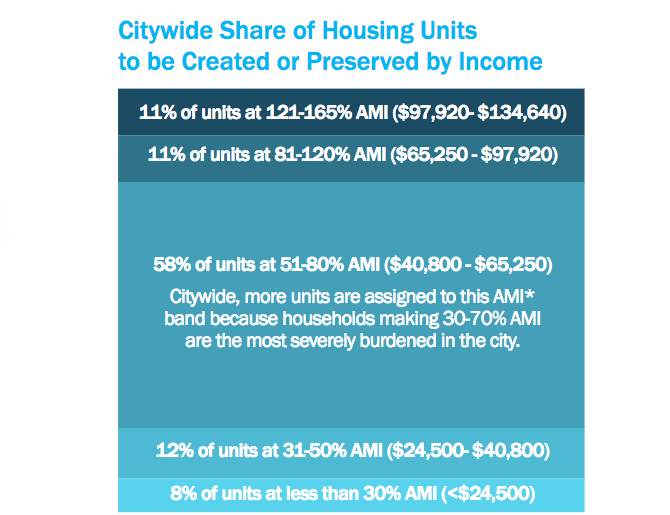
The document, presented to representatives of about 20 organizations during the first meeting on the Southern Boulevard potential rezoning in October, includes a diagram produced by the Department of Housing Preservation and Development (HPD) that shows the breakdown of housing units by income proposed in de Blasio’s 2014 Housing New York plan.
The diagram includes a sentence explaining why the administration intends to target the great majority of units in the plan to families making between 51 percent and 80 percent AMI, or between $40,800 and $65,250 for a family of three.
“Citywide, more units are assigned to this [Area Median Income] band because households making 30-70 percent AMI are the most severely rent burdened in the city,” the diagram reads, referring to families making between $24,480 and $57,120.
A household is considered “rent burdened” when they pay more than 30 percent of their income on rent, while a household is considered “severely” rent burdened when they pay more than 50 percent of their income on rent.
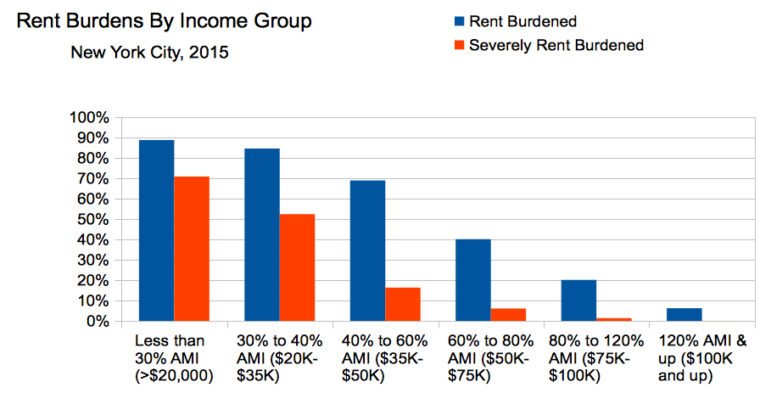
As reported by City Limits in November, however, rates of rent burdening and severe rent burdening are highest for households making less than $20,000.
According to census data compiled by the Association for Neighborhood and Housing Development (ANHD) for City Limits, roughly 71 percent of families making below $20,000 are severely rent-burdened, as opposed to about 52 percent making between $20,000 and $35,000, about 16 percent making between $35,000 and $50,000, and about 6 percent making between $50,000 and $75,000.
These conclusions about rent burdens are based on self-reported Census data that, depending on how households think about their rent and income, might not account for Section 8 vouchers and certain other public benefits more likely to be held by folks at the lowest end of the economic ladder than those slightly higher up, and possibly more concentrated in some areas than others—although the impact of such benefits on our overall conclusions would be modest.*
So HPD incorrectly characterizes families making between $24,480 and $57,120 as more severely rent-burdened than families making below $20,000. Some might argue that the design of the diagram also paves over the difference in severe rent burdening between families making between $24,480 and $40,800, for which the plan designates 12 percent of units, and those making between $40,800 and $65,250, for which the plan designates 58 percent of units.
This particular HPD graphic first appeared in the administration’s Housing New York plan in 2014, but originally did not include the sentence referring to rent burden. The alteration comes after two years in which the plan has come under criticism for not including enough units for extremely low-income families. While one can debate whether it should be a priority for the city to take on the high costs of creating more extremely low income units, one can’t argue with the facts of where the needs is greatest.
Or perhaps you can. “HPD’s research shows that households earning between 30 and 70 percent of the area median income have the highest prevalence of rent burden in general. That said, the use of the word ‘severely’ is incorrect,” said HPD representative Juliet Morris in response to City Limits’ inquiries, suggesting that the problem was the department’s mix up of the terms ‘rent burdening’ and ‘severe rent burdening.'”
But again, that’s not what the ANHD data shows: judged solely on “rent burdening,” and not “severe rent burdening,” lower-income households suffer more.* HPD declined a request to explain more deeply—though the agency did promise to tweak the document.
*Clarification: The census defines rent burden as the median percentage of gross, pre-tax income spent on rent and utility costs. Because the census gathers income and rent with a self-reported survey, it’s possible that some tenant households, asked to list “the monthly rent for this house,” report the rent on their lease when they’re actually paying less because of government assistance. This would happen in cases where households are both aware of the true market-rate rent of their apartment, and also receive rental assistance, such as for households with a section 8 housing choice voucher, public assistance with a rent allowance, Living In Communities Rental Assistance Program (LINC), Family Eviction Prevention Subsidy (FEPS), Special Exit and Prevention Program (SEPS), HOME Tenant-Based Rental Assistance, and some other programs. If the potential misreporting error were corrected for all such families, it’s possible that the difference in the percent of families in the <30 percent AMI and the 30-40 percent AMI brackets that are rent burdened would be eliminated or that families in the 30-40 percent AMI bracket might be rent-burdened at a slightly higher rate. However, families in the <30 percent AMI bracket would still be severely rent burdened in the highest percentages, and it’s likely it would still be untrue that families making less than 30 percent AMI are less rent-burdened than families making anywhere between 30 and 70 percent AMI.


2 thoughts on “De Blasio Admin. Says Housing Plan Serves the Most Burdened; Some Data Says Different”
A larger question is how many (or percentage of) people fall into each of the AMI categories. The allocation of affordable units should be determined based on a balance on severity of “rent burdenness” and the size (or percentage) of the population in the various AMI categories. Based on these data, we can’t tell if the allocation is justified.
I am shocked with this statistic because my landlord has the right to raise his rent to whatever he feels. Last years rent raised by $100 and this years rent raised by $400. The courts says if I am not paying they Grant me a little time to move. If my income streams is $24000- $40000 and my rent is $1300 monthly and is increased by $400. What is left because I pay for light, gas, hot water and heat. There is also cable and cell phone bills. My occupation is a substitute teacher. I need help so I have been looking into HPD options